Data report
Menopause Care Access Index: the best and worst states
The short answer
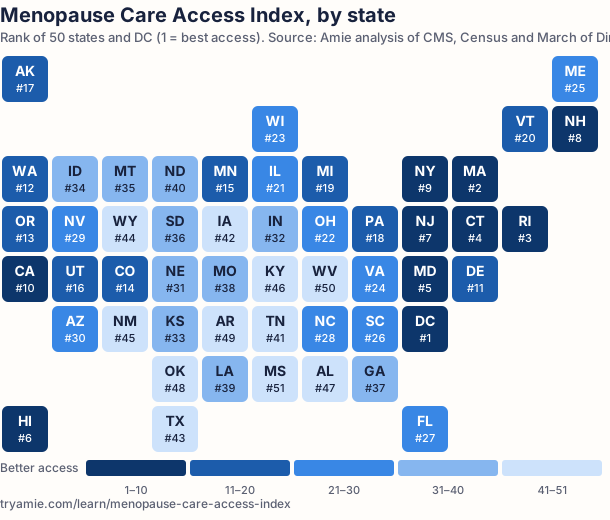
Among the 50 states, Massachusetts, Rhode Island, Connecticut and Maryland have the best access to menopause care, with Washington, D.C. at the very top. Mississippi, West Virginia, Arkansas, Oklahoma and Alabama have the worst. The index combines six public measures, from OB-GYN supply to insurance and broadband.
By the numbers
Menopause care access across the U.S.
The map
Each square is one state, the same size regardless of area, so small states stay visible. Darker blue means better access. Select a state to jump to its row in the table.
Best states for menopause care
- Washington, D.C. score 100.0
- Massachusetts score 88.4
- Rhode Island score 80.7
- Connecticut score 80.3
- Maryland score 78.1
Worst states for menopause care
- Mississippi score 0.0
- West Virginia score 12.7
- Arkansas score 15.9
- Oklahoma score 19.0
- Alabama score 21.4
Full ranking
| 1 | District of Columbia | 100.0 | 302.2 | 4.7% | 0.0% | 92.5% | 0.0% | $109,707 |
| 2 | Massachusetts | 88.4 | 109.8 | 2.3% | 0.0% | 94.4% | 8.7% | $104,828 |
| 3 | Rhode Island | 80.7 | 112.6 | 2.1% | 0.0% | 93.4% | 8.9% | $83,504 |
| 4 | Connecticut | 80.3 | 127.4 | 5.8% | 0.0% | 94.0% | 13.7% | $96,049 |
| 5 | Maryland | 78.1 | 107.0 | 5.3% | 0.0% | 94.4% | 14.4% | $102,905 |
| 6 | Hawaii | 78.0 | 106.8 | 3.3% | 0.0% | 93.0% | 13.9% | $100,745 |
| 7 | New Jersey | 74.7 | 100.9 | 7.3% | 0.0% | 94.8% | 6.2% | $104,294 |
| 8 | New Hampshire | 73.2 | 96.2 | 4.3% | 0.0% | 95.3% | 41.7% | $99,782 |
| 9 | New York | 70.1 | 103.1 | 4.5% | 0.4% | 93.1% | 12.6% | $85,820 |
| 10 | California | 69.1 | 75.6 | 6.2% | 0.2% | 95.0% | 5.8% | $100,149 |
| 11 | Delaware | 67.6 | 86.4 | 4.9% | 0.0% | 94.3% | 17.4% | $87,534 |
| 12 | Washington | 66.3 | 79.4 | 6.5% | 0.8% | 95.0% | 16.6% | $99,389 |
| 13 | Oregon | 65.9 | 98.6 | 5.7% | 0.4% | 93.7% | 19.5% | $85,220 |
| 14 | Colorado | 65.5 | 89.4 | 7.6% | 1.6% | 94.9% | 14.0% | $97,113 |
| 15 | Minnesota | 62.9 | 107.3 | 4.3% | 5.7% | 92.9% | 28.1% | $87,117 |
| 16 | Utah | 62.8 | 82.5 | 7.5% | 0.5% | 94.1% | 10.2% | $96,658 |
| 17 | Alaska | 58.6 | 129.9 | 10.1% | 5.5% | 93.6% | 35.1% | $95,665 |
| 18 | Pennsylvania | 56.9 | 93.8 | 5.2% | 1.0% | 92.1% | 23.5% | $77,545 |
| 19 | Michigan | 56.2 | 90.8 | 4.8% | 2.0% | 92.8% | 26.5% | $72,389 |
| 20 | Vermont | 56.1 | 103.9 | 4.5% | 0.7% | 92.7% | 64.9% | $82,730 |
| 21 | Illinois | 55.1 | 91.1 | 7.1% | 3.7% | 92.9% | 13.1% | $83,211 |
| 22 | Ohio | 51.2 | 95.7 | 6.3% | 3.4% | 92.2% | 23.7% | $72,212 |
| 23 | Wisconsin | 51.1 | 85.5 | 4.9% | 3.5% | 92.3% | 32.9% | $77,488 |
| 24 | Virginia | 50.7 | 87.0 | 6.7% | 7.4% | 92.8% | 24.4% | $92,090 |
| 25 | Maine | 49.2 | 89.0 | 4.9% | 0.0% | 92.4% | 61.4% | $76,442 |
| 26 | South Carolina | 47.4 | 93.6 | 8.2% | 2.2% | 92.9% | 32.1% | $72,350 |
| 27 | Florida | 46.9 | 71.3 | 10.7% | 0.8% | 94.3% | 8.5% | $77,735 |
| 28 | North Carolina | 46.9 | 92.2 | 8.4% | 2.9% | 93.2% | 33.3% | $73,958 |
| 29 | Nevada | 45.5 | 67.4 | 11.1% | 4.2% | 95.1% | 5.9% | $81,134 |
| 30 | Arizona | 45.3 | 67.0 | 10.3% | 0.3% | 93.6% | 10.7% | $81,486 |
| 31 | Nebraska | 44.8 | 103.0 | 7.6% | 8.3% | 91.9% | 27.0% | $76,376 |
| 32 | Indiana | 44.1 | 91.1 | 7.1% | 5.2% | 92.0% | 28.8% | $71,959 |
| 33 | Kansas | 38.1 | 82.2 | 8.9% | 6.8% | 92.5% | 27.7% | $75,514 |
| 34 | Idaho | 37.8 | 71.4 | 9.6% | 3.7% | 92.8% | 30.8% | $81,166 |
| 35 | Montana | 37.2 | 95.5 | 8.2% | 6.0% | 91.5% | 46.6% | $75,340 |
| 36 | South Dakota | 36.5 | 101.0 | 5.8% | 15.3% | 91.3% | 42.8% | $76,881 |
| 37 | Georgia | 35.5 | 76.4 | 11.0% | 6.9% | 93.4% | 25.9% | $79,991 |
| 38 | Missouri | 34.7 | 89.2 | 7.1% | 11.4% | 91.3% | 30.5% | $71,589 |
| 39 | Louisiana | 34.6 | 92.8 | 7.3% | 7.0% | 90.5% | 28.5% | $60,986 |
| 40 | North Dakota | 34.6 | 91.9 | 4.7% | 16.3% | 90.7% | 39.0% | $77,871 |
| 41 | Tennessee | 32.8 | 81.0 | 10.0% | 6.7% | 92.5% | 33.8% | $71,997 |
| 42 | Iowa | 32.3 | 76.9 | 5.1% | 12.7% | 90.7% | 36.8% | $75,501 |
| 43 | Texas | 31.6 | 69.5 | 16.2% | 4.2% | 93.7% | 16.3% | $79,721 |
| 44 | Wyoming | 30.9 | 96.8 | 9.9% | 5.1% | 89.9% | 38.0% | $75,532 |
| 45 | New Mexico | 26.6 | 82.2 | 12.1% | 2.0% | 90.5% | 25.5% | $67,816 |
| 46 | Kentucky | 24.3 | 83.4 | 6.6% | 15.8% | 90.9% | 41.3% | $64,526 |
| 47 | Alabama | 21.4 | 69.1 | 8.5% | 11.9% | 91.6% | 42.3% | $66,659 |
| 48 | Oklahoma | 19.0 | 69.7 | 11.5% | 10.0% | 92.1% | 35.4% | $66,148 |
| 49 | Arkansas | 15.9 | 66.2 | 8.2% | 13.0% | 90.8% | 44.5% | $62,106 |
| 50 | West Virginia | 12.7 | 77.0 | 6.3% | 17.0% | 89.4% | 55.4% | $60,798 |
| 51 | Mississippi | 0.0 | 77.1 | 10.1% | 18.1% | 88.3% | 53.7% | $59,127 |
Scores run from 0 (lowest access of the 51) to 100 (highest). Sources: CMS, 2026, U.S. Census Bureau, 2025, ACS 2024, March of Dimes, 2026, ACS 2024, 2020 Census, ACS 2024. Download the data (CSV).
Key findings
- Massachusetts, Rhode Island and Connecticut lead the states; Mississippi, West Virginia and Arkansas trail. Washington, D.C. tops the index largely because of its very high concentration of OB-GYNs; among the 50 states, Massachusetts, Rhode Island and Connecticut rank highest. Mississippi, West Virginia, Arkansas, Oklahoma and Alabama make up the bottom five. Source: CMS, 2026, ACS 2024, March of Dimes, 2026.
- The best-supplied state has 2.0 times as many OB-GYNs per woman as the least. Alaska has 129.9 OB-GYNs per 100,000 women aged 45 to 64; Arkansas has 66.2. The national figure is 86.0. Source: CMS, 2026, U.S. Census Bureau, 2025.
- In Texas, about 1 in 6 women aged 45 to 64 has no health insurance. Texas’s rate is 16.2%, against 7.9% nationally and 2.1% in Rhode Island. Source: ACS 2024.
- Maternity care deserts are concentrated in a handful of states. In Mississippi, West Virginia and North Dakota, 18.1%, 17.0% and 16.3% of women aged 15 to 44 live in a county with no obstetric hospital, birth center or obstetric clinician, compared with 3.5% nationally. In 10 places, including D.C., the share rounds to zero. Source: March of Dimes, 2026.
- 7.1 million women aged 45 to 64 live in the 10 lowest-ranked states. That is 17% of the 41.8 million women in this age group nationwide. Source: U.S. Census Bureau, 2025.
- The state with the least home broadband also ranks last overall. Mississippi has the lowest share of households with a broadband subscription (88.3%, vs 93.2% nationally) and also ranks last overall. Source: ACS 2024.
- The ranking holds up under different assumptions. With all six inputs weighted equally, 9 of the top 10 and 9 of the bottom 10 stay the same (rank correlation 0.977). Swapping our OB-GYN count for HRSA’s AMA-based count gives a rank correlation of 0.98. Source: HRSA AHRF 2024–2025.
Where telehealth fits
In states with fewer OB-GYNs or long drives to a specialist, telehealth is one way to reach a clinician. Amie’s licensed clinicians prescribe menopause treatment online in all 50 states, and each state’s page explains how it works there: online HRT by state. A clinician decides whether treatment is right for you; this index is not medical advice.
How we built it
The index ranks the 50 states and Washington, D.C. on six measures of how easy it is for a woman in midlife to get menopause care. We used only public data and chose measures that are published for every state, are recent and relate directly to access.
| Measure | Weight | Direction | Source and year | Why it’s included |
|---|---|---|---|---|
| OB-GYNs per 100,000 women aged 45 to 64 | 30% | Higher is better | Centers for Medicare & Medicaid Services, Doctors and Clinicians National Downloadable File (October 2026 release); U.S. Census Bureau, Population Estimates Vintage 2025, state population by sex and single year of age (July 1, 2025) | OB-GYNs provide much of the menopause care women get in person. We count clinicians whose primary specialty is obstetrics and gynecology at a practice address in the state, per 100,000 women aged 45 to 64, the years when perimenopause and menopause usually happen. |
| Share of women aged 45 to 64 with no health insurance | 20% | Lower is better | U.S. Census Bureau, American Community Survey 2024 1-year estimates, table B27001 (health insurance coverage by sex by age) | Without coverage, office visits, prescriptions and follow-up cost more out of pocket. This is measured for women aged 45 to 64 specifically. |
| Share of women aged 15 to 44 living in a maternity care desert county | 15% | Lower is better | March of Dimes, Nowhere to Go: Maternity Care Deserts Across the US (2026 report); state values via America’s Health Rankings | March of Dimes defines a maternity care desert as a county with no hospital offering obstetric care, no birth center and no obstetric clinician. It is measured for women of reproductive age, so we use it as a proxy for how far local gynecologic infrastructure reaches, not as a direct measure of menopause care. |
| Share of households with a broadband internet subscription | 15% | Higher is better | U.S. Census Bureau, American Community Survey 2024 1-year estimates, table B28002 (internet subscriptions in household) | Video visits and patient portals need a reliable connection, so broadband is a practical measure of how reachable telehealth is. |
| Share of residents living in rural areas | 10% | Lower is better | U.S. Census Bureau, 2020 Census state urban and rural population | Specialists are scarcer outside cities: March of Dimes’ 2026 report found that nearly 58% of rural counties have no obstetric clinician, compared with about 19% of urban counties. |
| Median household income | 10% | Higher is better | U.S. Census Bureau, American Community Survey 2024 1-year estimates, table B19013 (median household income) | A rough measure of how affordable care is for households, including costs insurance doesn’t cover. |
Scoring
For each measure we computed a standard score (the number of standard deviations from the mean of the 51 places), flipped the sign where lower is better, and capped scores at ±2.5 so a single extreme value, such as D.C.’s OB-GYN density, cannot dominate. We took the weighted sum and rescaled it so the lowest place scores 0 and the highest 100. OB-GYN supply carries the most weight because it is the most direct measure of in-person specialist access.
Counting OB-GYNs
We counted unique clinicians (by NPI) whose primary specialty is obstetrics/gynecology at a practice address in each state in the CMS Doctors and Clinicians file, which lists clinicians enrolled in Medicare and includes both MDs and DOs. A clinician with offices in two states counts in both. Clinicians not enrolled in Medicare are not listed, so these counts are a conservative floor. As a check, we re-ran the index with HRSA’s Area Health Resources File count of MD OB-GYNs in patient care (AMA Physician Masterfile, end of 2023): the two counts rank states similarly (rank correlation 0.763) and the final index barely moves (0.98). Population denominators are Census Bureau 2025 estimates of women aged 45 to 64.
Robustness
With equal weights for all six measures, the rank correlation with our weighting is 0.977 and no place moves more than 9 spots. Dropping income changes almost nothing (0.995). Both alternative ranks are in the CSV.
What we left out, and why
- Menopause Society Certified Practitioners per capita. The Society’s practitioner directory includes only clinicians who opt in and are accepting new patients, and its terms limit use of the listings to finding a practitioner, so we did not compile counts from it.
- State telehealth and insurance laws. Rules change often and are hard to score fairly, so the index measures access conditions, not policy.
- Physician counts from the AAMC. The AAMC state workforce data is not published as a downloadable state-by-specialty file we could reproduce, so we used CMS and HRSA files anyone can download.
Limitations
OB-GYNs are not the only clinicians who treat menopause; primary care clinicians, nurse practitioners and certified nurse-midwives do too, and they are not counted here. The maternity care desert measure covers women of reproductive age and is a proxy for local gynecologic infrastructure. ACS estimates have margins of error, which are larger in small states. State averages hide large differences within states.
Download the data
The CSV has every input, the score, the rank and the two alternative ranks, with the data year in each column name.
Embed this map
Copy this code to put the map on your site. Please keep the credit link.
For reporters
You’re welcome to use the rankings, map and data with credit to “Amie Menopause Care Access Index” and a link to this page. Every state’s rank, score and inputs are in the table above and in the CSV, and each state has its own page with local figures (for example, Texas or Ohio).
Suggested citation: Amie. Menopause Care Access Index: the best and worst states. October 22, 2026. https://tryamie.com/learn/menopause-care-access-index
For questions about the method or data, email support@tryamie.com with “Menopause Care Access Index” in the subject.
Common questions
Which state is best for menopause care access?
Among the 50 states, Massachusetts ranks highest in the Menopause Care Access Index, followed by Rhode Island and Connecticut. Washington, D.C. scores highest overall because of its large number of OB-GYNs.
Which state is worst for menopause care access?
Mississippi ranks last, followed by West Virginia, Arkansas, Oklahoma and Alabama.
How is the Menopause Care Access Index calculated?
We combine six public measures: OB-GYNs per 100,000 women aged 45 to 64 (30%), the uninsured rate for women 45 to 64 (20%), the share of women living in maternity care deserts (15%), household broadband (15%), rural population share (10%) and median household income (10%). Each is converted to a standard score, capped, weighted and scaled from 0 to 100.
Can I use this data or map?
Yes. Download the CSV or embed the map. Please credit “Amie Menopause Care Access Index” with a link to this page.
Does a low rank mean women there can’t get menopause care?
No. The index compares how easy access is on average. Women in every state can see a clinician, in person or by telehealth, but in lower-ranked states there are fewer OB-GYNs per woman, more uninsured women or longer distances.
Sources
- Centers for Medicare & Medicaid Services, Doctors and Clinicians National Downloadable File (October 2026 release)
- U.S. Census Bureau, Population Estimates Vintage 2025, state population by sex and single year of age (July 1, 2025)
- U.S. Census Bureau, American Community Survey 2024 1-year estimates, table B27001 (health insurance coverage by sex by age)
- March of Dimes, Nowhere to Go: Maternity Care Deserts Across the US (2026 report); state values via America’s Health Rankings
- March of Dimes, Nowhere to Go: Maternity Care Deserts Across the US, 2026 report
- U.S. Census Bureau, American Community Survey 2024 1-year estimates, table B28002 (internet subscriptions in household)
- U.S. Census Bureau, 2020 Census state urban and rural population
- U.S. Census Bureau, American Community Survey 2024 1-year estimates, table B19013 (median household income)
- HRSA, Area Health Resources Files 2024–2025 (AMA Physician Masterfile, December 31, 2023): non-federal MD OB-GYNs in patient care